
Page 15 - CEGE Magazine Spring 2017
P. 15
weakest-link model is able to capture the effect of that element size on the probability distribution of the structural strength. The new model predicts that the probability distribution of structural strength will transition from a pre- dominantly Gaussian distribution to a Weibull distribution as the structure size increases (Figure 1). As a result, the conventional infinite weakest-link model (which leads to the Weibull strength dis- tribution) becomes a limiting case of this general model for large-size structures.
The size dependence of strength distribution directly leads to an intricate size effect on the mean strength of the structure, which predicts that large structures will be weaker than small structures (Figure 1). This phenomenon can be explained by the fact that a large structure likely contains more weak spots compared to a small structure, and the strength of the structure is determined by the strength of the weakest spot. There- fore the average failure stress of a large structure would be smaller than that of a small structure.
Such a statistical size effect was first speculated by Leonardo da Vinci in 1500s, and qualitatively explained by Edem Mariotte in 1686. In 1939, Weibull
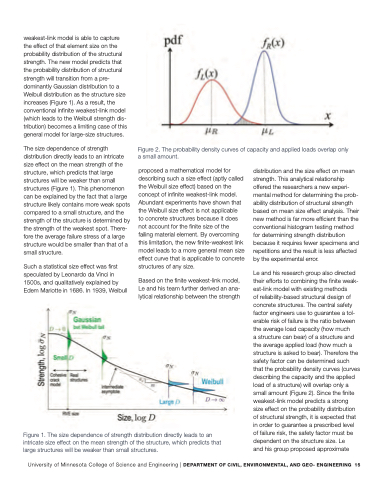
Figure 2. The probability density curves of capacity and applied loads overlap only a small amount.
proposed a mathematical model for describing such a size effect (aptly called the Weibull size effect) based on the concept of infinite weakest-link model. Abundant experiments have shown that the Weibull size effect is not applicable
to concrete structures because it does not account for the finite size of the failing material element. By overcoming this limitation, the new finite-weakest link model leads to a more general mean size effect curve that is applicable to concrete structures of any size.
Based on the finite weakest-link model, Le and his team further derived an ana- lytical relationship between the strength
distribution and the size effect on mean strength. This analytical relationship offered the researchers a new experi- mental method for determining the prob- ability distribution of structural strength based on mean size effect analysis. Their new method is far more efficient than the conventional histogram testing method for determining strength distribution because it requires fewer specimens and repetitions and the result is less affected by the experimental error.
Le and his research group also directed their efforts to combining the finite weak- est-link model with existing methods
of reliability-based structural design of concrete structures. The central safety factor engineers use to guarantee a tol- erable risk of failure is the ratio between the average load capacity (how much
a structure can bear) of a structure and the average applied load (how much a structure is asked to bear). Therefore the safety factor can be determined such that the probability density curves (curves describing the capacity and the applied load of a structure) will overlap only a small amount (Figure 2). Since the finite weakest-link model predicts a strong
size effect on the probability distribution of structural strength, it is expected that in order to guarantee a prescribed level of failure risk, the safety factor must be dependent on the structure size. Le and his group proposed approximate
Figure 1. The size dependence of strength distribution directly leads to an intricate size effect on the mean strength of the structure, which predicts that large structures will be weaker than small structures.
University of Minnesota College of Science and Engineering | DEPARTMENT OF CIVIL, ENVIRONMENTAL, AND GEO- ENGINEERING 15
