
Page 17 - Demo
P. 17
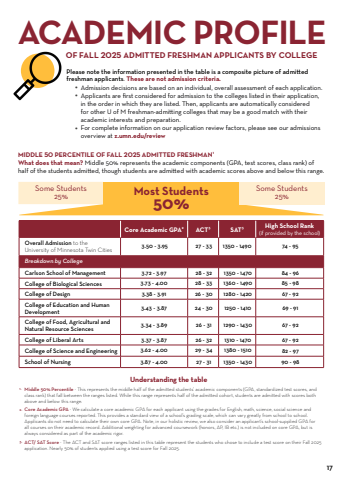
17ACADEMIC PROFILEOF FALL 2025 ADMITTED FRESHMAN APPLICANTS BY COLLEGEPlease note the information presented in the table is a composite picture of admitted freshman applicants. These are not admission criteria.%u2022 Admission decisions are based on an individual, overall assessment of each application. %u2022 Applicants are first considered for admission to the colleges listed in their application, in the order in which they are listed. Then, applicants are automatically considered for other U of M freshman-admitting colleges that may be a good match with their academic interests and preparation. %u2022 For complete information on our application review factors, please see our admissions overview at z.umn.edu/reviewMIDDLE 50 PERCENTILE OF FALL 2025 ADMITTED FRESHMAN1What does that mean? Middle 50% represents the academic components (GPA, test scores, class rank) of half of the students admitted, though students are admitted with academic scores above and below this range.Some Students 25%Some Students Most Students 25% 50%Core Academic GPA2 ACT3 SAT3 High School Rank(if provided by the school)Overall Admission to the University of Minnesota Twin Cities 3.50 - 3.95 27 - 33 1350 - 1490 74 - 95Breakdown by CollegeCarlson School of Management 3.72 - 3.97 28 - 32 1350 - 1470 84 - 96College of Biological Sciences 3.73 - 4.00 28 - 33 1360 - 1490 85 - 98College of Design 3.38 - 3.91 26 - 30 1280 - 1420 67 - 92College of Education and Human Development 3.43 - 3.87 24 - 30 1250 - 1410 69 - 91College of Food, Agricultural and Natural Resource Sciences 3.34 - 3.89 26 - 31 1290 - 1430 67 - 92College of Liberal Arts 3.37 - 3.87 26 - 32 1310 - 1470 67 - 92College of Science and Engineering 3.62 - 4.00 29 - 34 1380 - 1510 82 - 97School of Nursing 3.87 - 4.00 27 - 31 1350 - 1430 90 - 981. Middle 50% Percentile - This represents the middle half of the admitted students%u2019 academic components (GPA, standardized test scores, and class rank) that fall between the ranges listed. While this range represents half of the admitted cohort, students are admitted with scores both above and below this range. 2. Core Academic GPA - We calculate a core academic GPA for each applicant using the grades for English, math, science, social science and foreign language courses reported. This provides a standard view of a school%u2019s grading scale, which can vary greatly from school to school. Applicants do not need to calculate their own core GPA. Note, in our holistic review, we also consider an applicant%u2019s school-supplied GPA for all courses on their academic record. Additional weighting for advanced coursework (honors, AP, IB etc.) is not included on core GPA, but is always considered as part of the academic rigor. 3. ACT/ SAT Score - The ACT and SAT score ranges listed in this table represent the students who chose to include a test score on their Fall 2025 application. Nearly 50% of students applied using a test score for Fall 2025. Understanding the table
